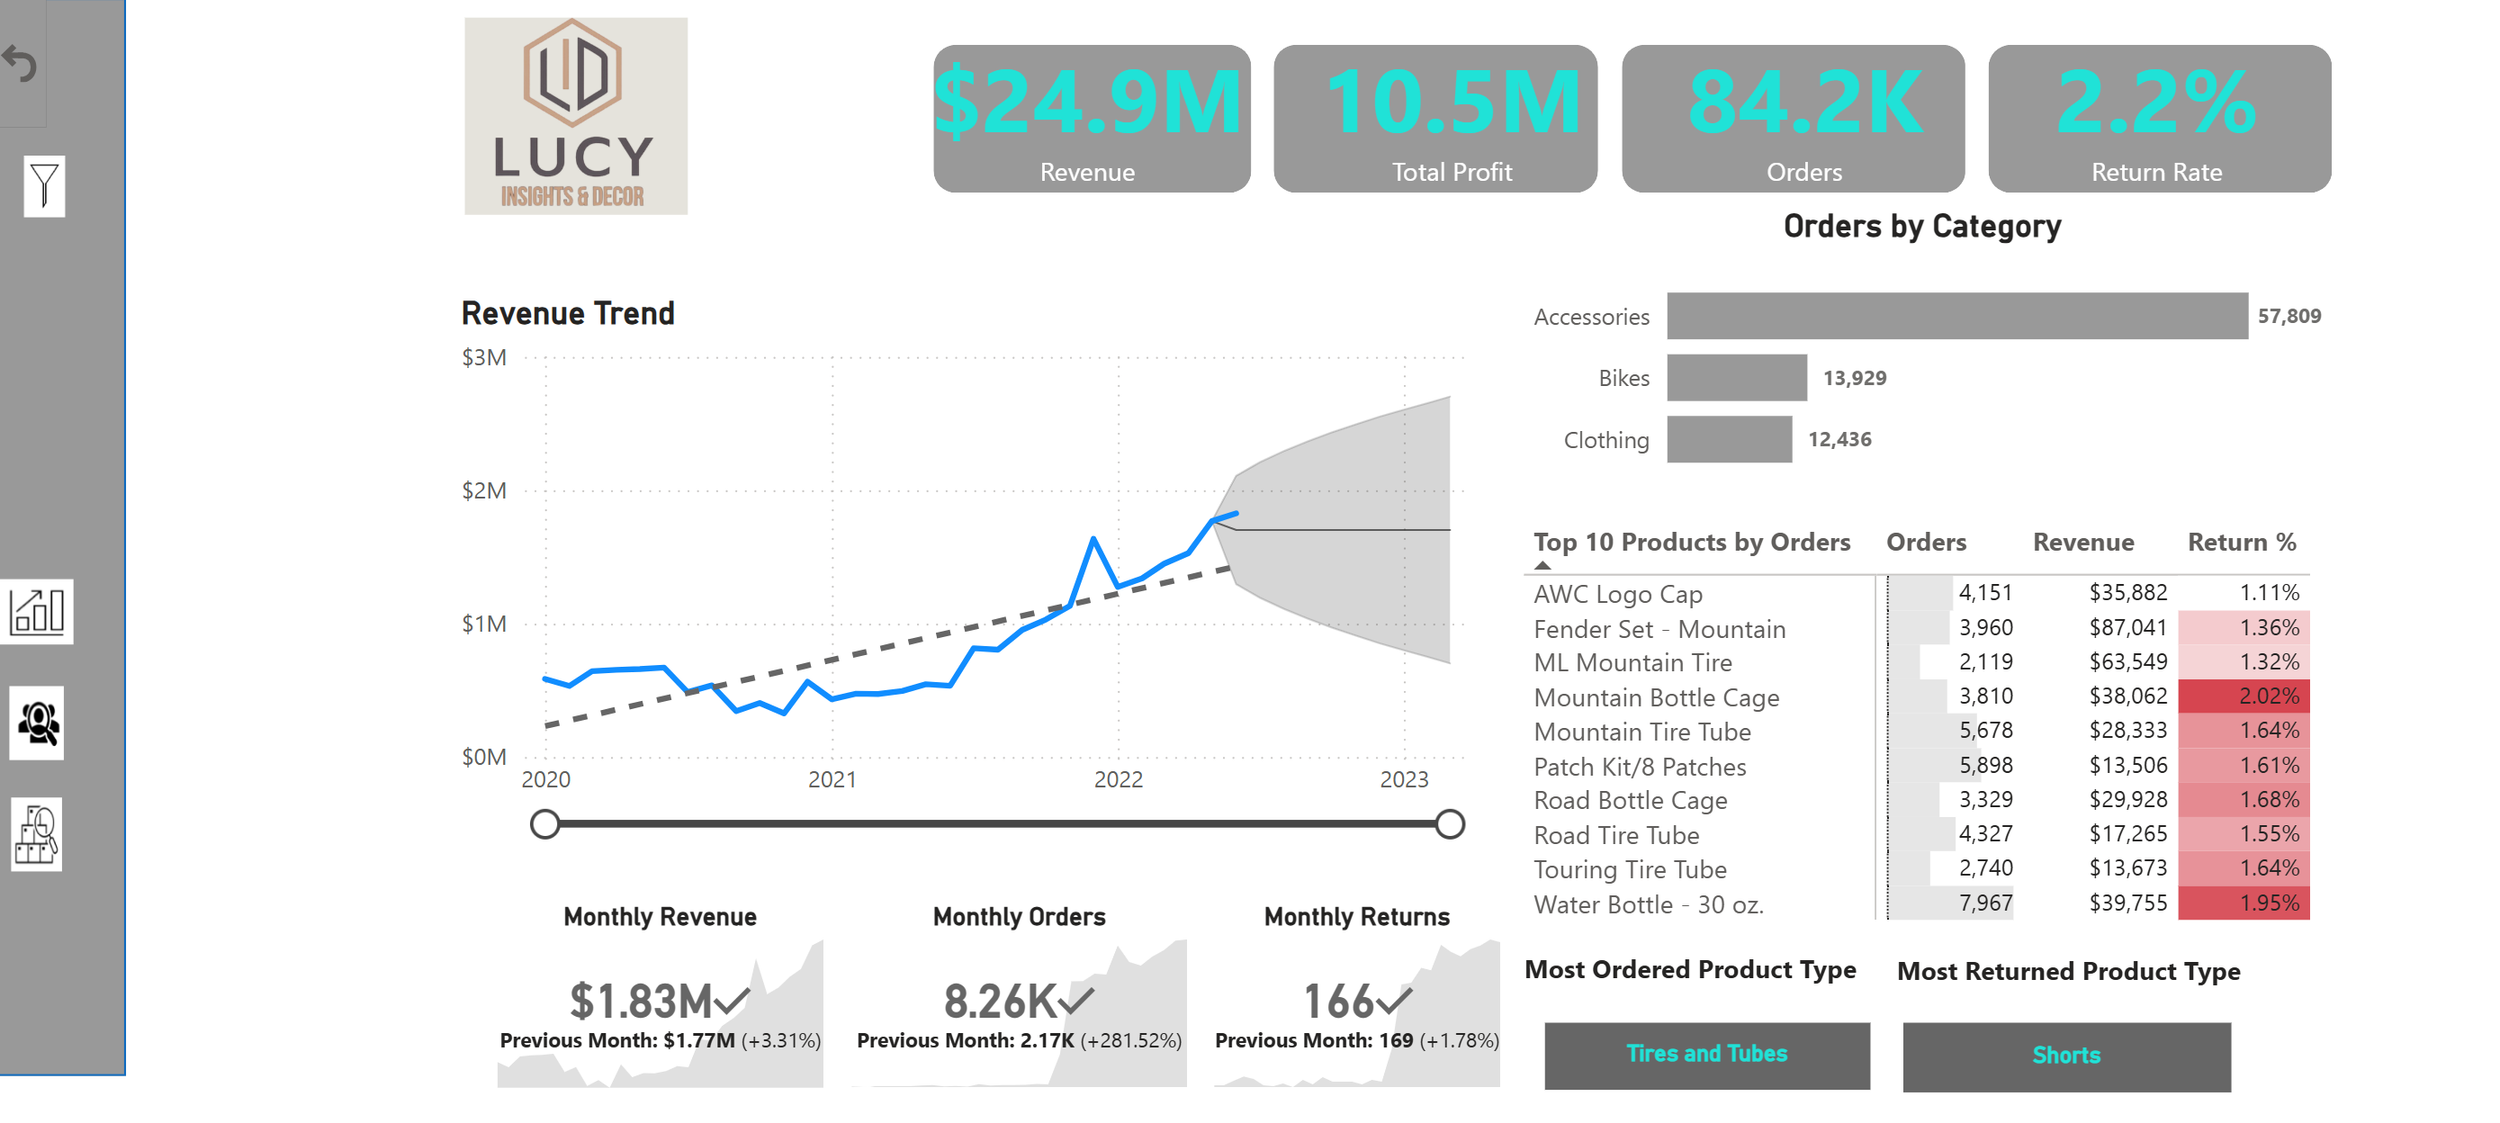
Do You Have Analytical Needs?
Whether you're building your first dashboard in Excel or managing complex enterprise BI platforms, we're here to help you turn data into decisions.
From simple reporting to advanced trend analysis, we support you at every stage of your data journey — using the industry's most powerful tools: Power BI, Tableau, Oracle Analytic Cloud, Microsoft Fabric etc.
Insight-Driven Analytics Solutions
What We Help With
Need help making sense of your Excel data?
Looking to have interactive and user-friendly dashboards?
Struggling with performance, modeling, or integration?
Why Work With Us?
Certified Experts in Power BI, Tableau, Oracle & Microsoft
Friendly, jargon-free guidance for any skill level
Hands-on training & long-term support available
Solutions tailored to your industry and business goals
Schedule a consultation
Want to schedule a consultation with our experts? Reach out through phone or email! Or leave us a message through this form.


